USD/CAD Price Analysis: Advances towards 1.2400 inside weekly triangle
- USD/CAD picks up bids to refresh intraday top.
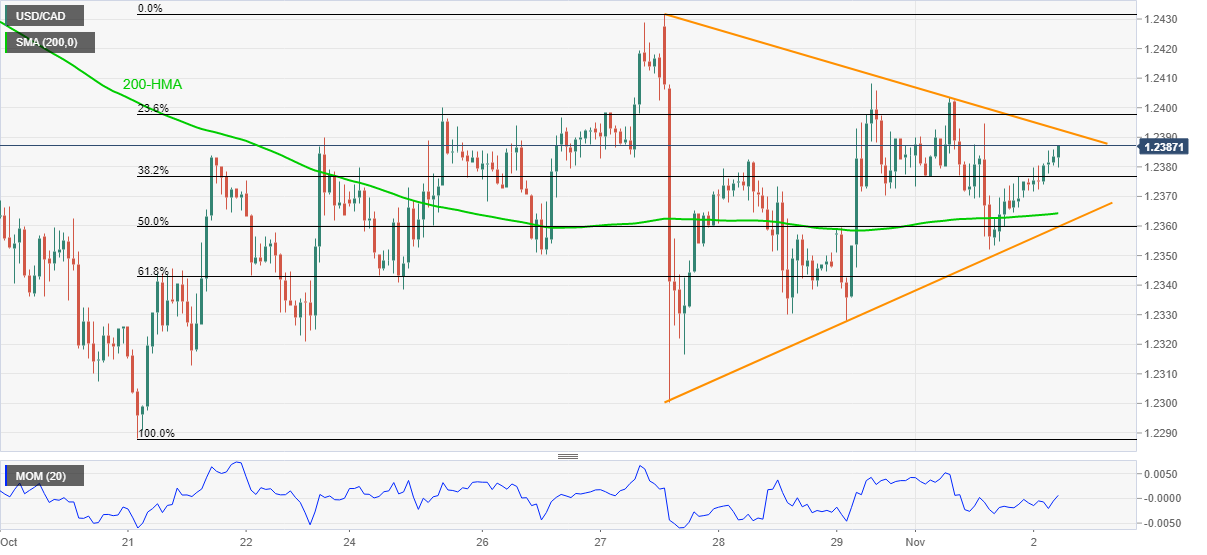
- One-week-old symmetrical triangle restricts immediate moves above 200-HMA.
- Firmer Momentum line keeps buyers hopeful, key Fibonacci retracement levels add to the downside filters.
USD/CAD remains firmer around the day’s top of 1.2385, up 0.11% intraday ahead of the European session. That said, the quote remains inside a four-day-old symmetrical triangle by the press time of Tuesday.
It’s worth noting that the Loonie pair’s successful trading above 200-HMA and firmer Momentum line adds strength to the bullish bias.
However, a clear upside break of the triangle’s resistance line, near 1.2395, becomes necessary for the USD/CAD optimists to aim for the latest swing high near 1.2430.
In a case where the pair buyers remain dominant past 1.2430, September’s low near 1.2490 will be in focus.
Alternatively, 200-HMA tests immediate downside near 1.2365 before the triangle’s support line near 1.2360.
If at all the USD/CAD bears manage to conquer the 1.2360 support, odds of the following plunge towards October’s low, also the lowest since June 2021 around 1.2285, gains the market’s attention.
USD/CAD: Hourly chart
Trend: Further upside expected