Gold Price Forecast: XAU/USD bulls remain hopeful while above $1792 – Confluence Detector
- Gold price drops as the US dollar attempts a bounce amid cautious mood.
- Treasury yields retreat ahead of the key Fed event this week.
- Gold to stay in consolidation ahead of Jackson Hole.
Gold price is pressurizing daily lows below $1800, as the US dollar is holding onto its recent bounce across the board. The cautious tone on the global markets is keeping the haven demand for the greenback underpinned while weighing on gold price. However, gold’s downside appears limited by the latest retracement in the US Treasury yields. Fading tapering expectations amid a surge in cases of the Delta covid variant globally undermine the yields. Investors turn cautious ahead of the Fed’s Jackson Hole Symposium, starting Thursday, with all eyes on Chair Jerome Powell’s speech for fresh guidance on the central bank’s next policy move.
Read: How to trade the Jackson Hole meeting
Gold Price: Key levels to watch
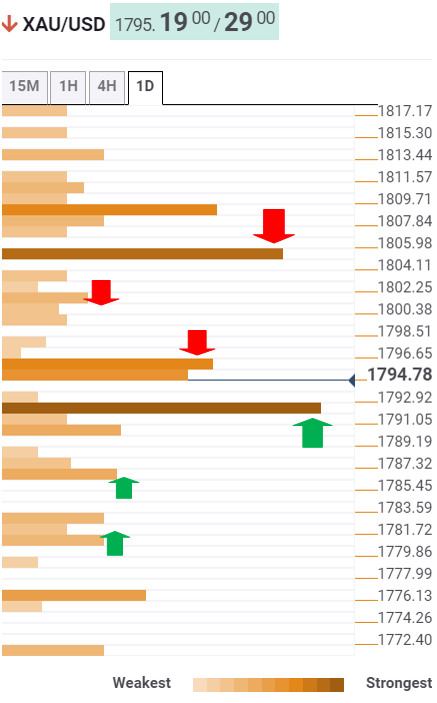
The Technical Confluences Detector shows that gold has bounced off fierce support at $1792, which is the intersection of the SMA50 one-day, SMA5 one-day and Fibonacci 61.8% one-month.
The bright metal confronts a cluster of resistance levels around $1795-$1796 on its tepid recovery. That is the level where the SMA200 four-hour, the previous week’s high and pivot point one-week R1 converge.
If the reversal picks up traction, then the previous day’s low of $1801 could be back on the buyers’ radar.
The next powerful resistance awaits at the Fibonacci 38.2% one-day at $1805.
On the flip side, a sustained break below the abovementioned key support at $1792 could initiate a fresh downswing towards $1786 levels, which is the Fibonacci 38.2% one-week.
Ahead of that cap, the $1790 demand area could come to the rescue of gold bulls.
The last line of defense for the optimists is seen around the $1780 prize zone, the meeting point of the SMA10 one-day and the Fibonacci 61.8% one-week.
Here is how it looks on the tool

About Technical Confluences Detector
The TCD (Technical Confluences Detector) is a tool to locate and point out those price levels where there is a congestion of indicators, moving averages, Fibonacci levels, Pivot Points, etc. If you are a short-term trader, you will find entry points for counter-trend strategies and hunt a few points at a time. If you are a medium-to-long-term trader, this tool will allow you to know in advance the price levels where a medium-to-long-term trend may stop and rest, where to unwind positions, or where to increase your position size.
