EUR/USD Price Analysis: The 55-day SMA near 1.2050 offers support… for now
- EUR/USD deflates following an earlier move to 1.2160.
- The mid-1.2000s offers decent support for the time being.
EUR/USD surpassed the 1.2100 mark on Wednesday, although the bullish impulse run out of gas near 1.2160.
If the recovery picks up extra steam, then the next interim hurdle emerges at the Fibo retracement (of the November-January rally) at 1.2173. Further up, there are no relevant levels until the YTD peaks in the 1.2350 zone.
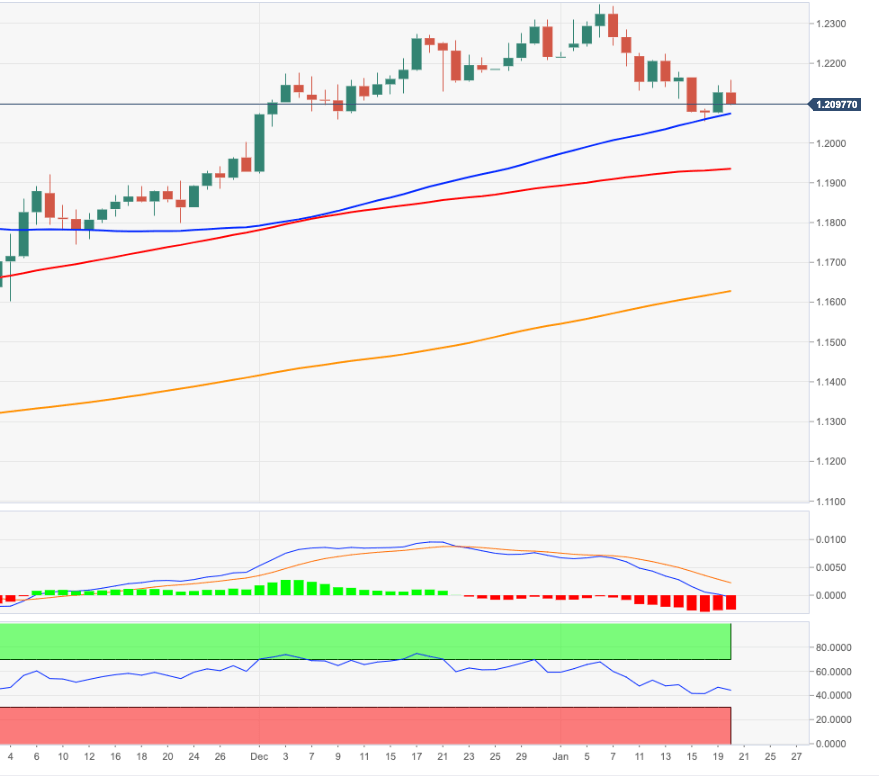
Further decline is expected to meet initial support in the 1.2050 region, where coincide recent lows and the 55-day SMA. A deeper pullback carries the potential to challenge the psychological support at 1.20 the figure, although a move further south of this level is not favoured in the short-term horizon. Below 1.2000 is located a Fibo level at 1.1976.
On the broader picture, the constructive stance in EUR/USD remains unchanged while above the critical 200-day SMA, today at 1.1614.
Looking at the monthly chart, the (solid) breakout of the 2008-2020 line is a big bullish event and should underpin the continuation of the current trend in the longer run.
EUR/USD daily chart