Gold Price Analysis: XAU/USD bounces with stocks, levels to watch – Confluence Detector
Gold has been on the rise, trading above $1,940 after struggling on lower ground. The precious metal is rising alongside stock markets. Investors are shrugging off concerns that a coronavirus vaccine may be delayed – AstraZeneca suspended its Phase 3 trial.
XAU/USD could be benefiting from hopes that Republicans and Democrats strike a deal and provide more relief. That may be due to worsening polling figures for President Donald Trump.
How is gold positioned on the charts?
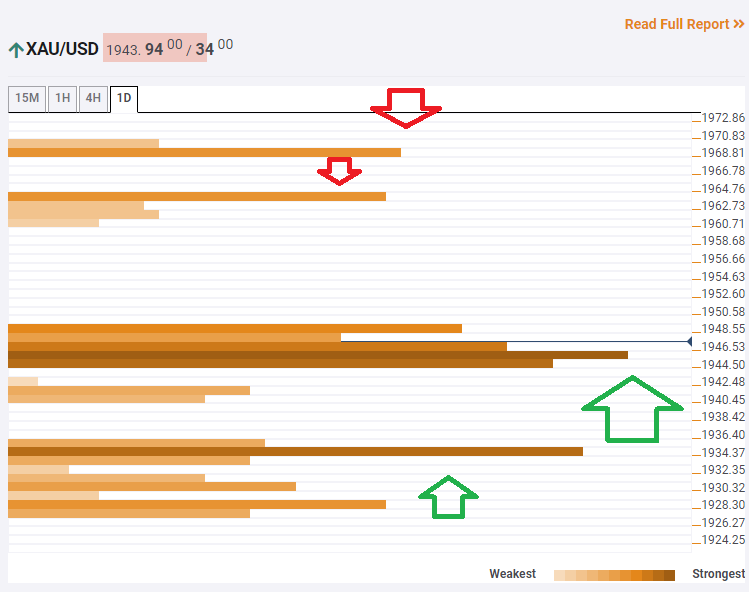
The Technical Confluences Indicator is showing that XAU/SD has overcome substantial support at around $1,944, which is a dense cluster of lines including the Simple Moving Average 10-one-day, the Fibonacci 38.2% one-week, the Fibonacci 38.2% one-month, the Bollinger Band 15min-Upper, the Pivot Point one-day Resistance 1, and more.
Looking up, resistance awaits at $1,963, which is the convergence of the Fibonacci 61.8% one-week and the SMA 200-4h.
Next, the upside target is $1,9671, where the PP one-day R2 hits the price.
Low support awaits at $1,934, which is the confluence of the SMA 5-one-day, the Fibonacci 23.6% one-week, and the Fibonacci 23.6% one-day.
Key XAU/USD resistances and supports
Confluence Detector
The Confluence Detector finds exciting opportunities using Technical Confluences. The TC is a tool to locate and point out those price levels where there is a congestion of indicators, moving averages, Fibonacci levels, Pivot Points, etc. Knowing where these congestion points are located is very useful for the trader, and can be used as a basis for different strategies.
Learn more about Technical Confluence