Back


28 May 2020
US Dollar Index Asia Price Forecast: DXY drops to fresh 2-month lows
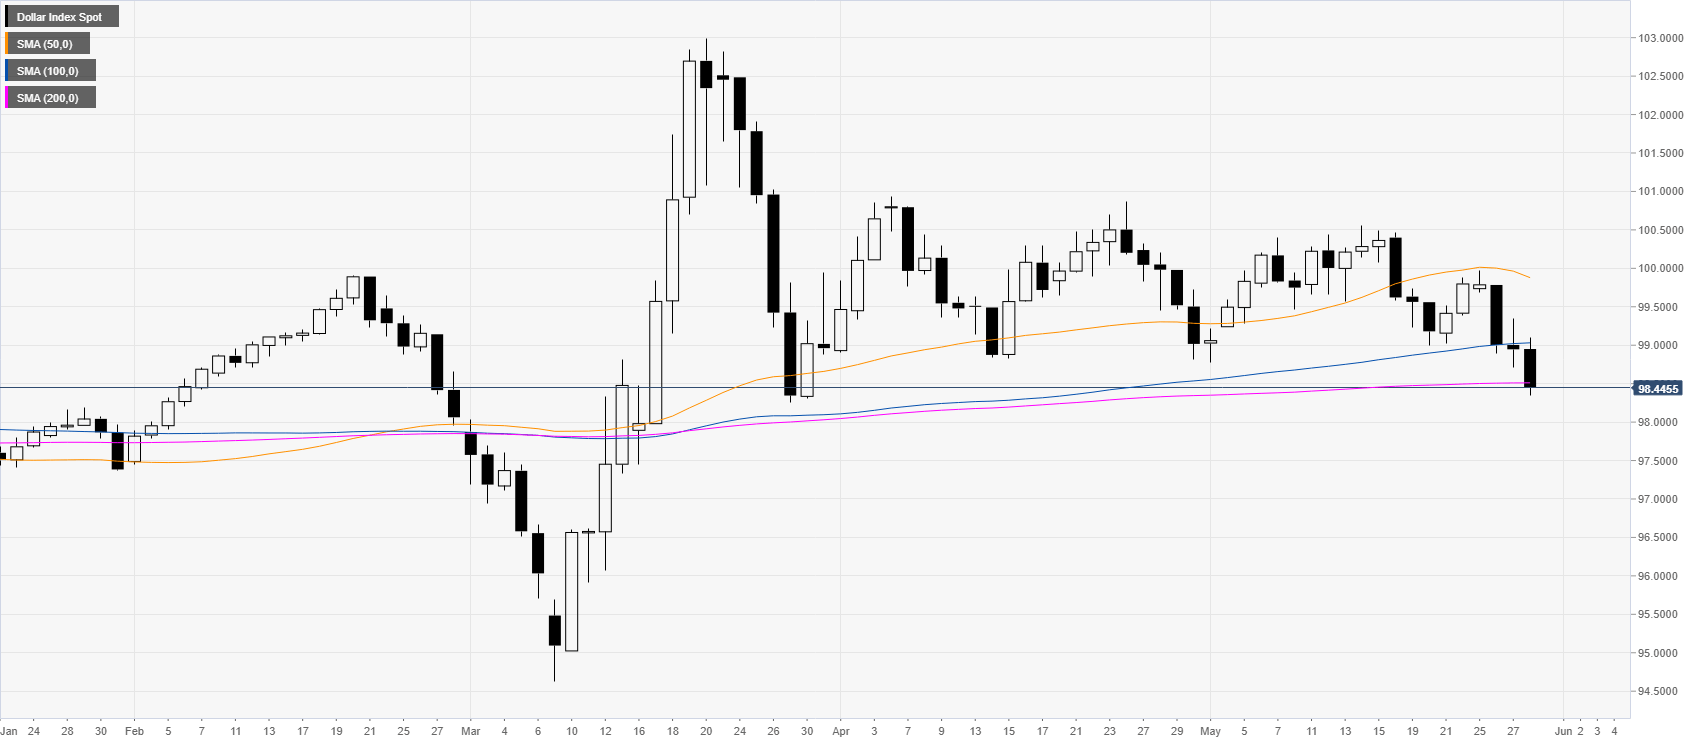
- US Dollar Index (DXY) fails to rebound from the May’s lows.
- DXY break down to its lowest point in 2-months.
DXY daily chart
The US Dollar Index (DXY) is trading to its lowest level since late March 2020. The risk-on mood in Wall Street is decreasing the demand for the US dollar.

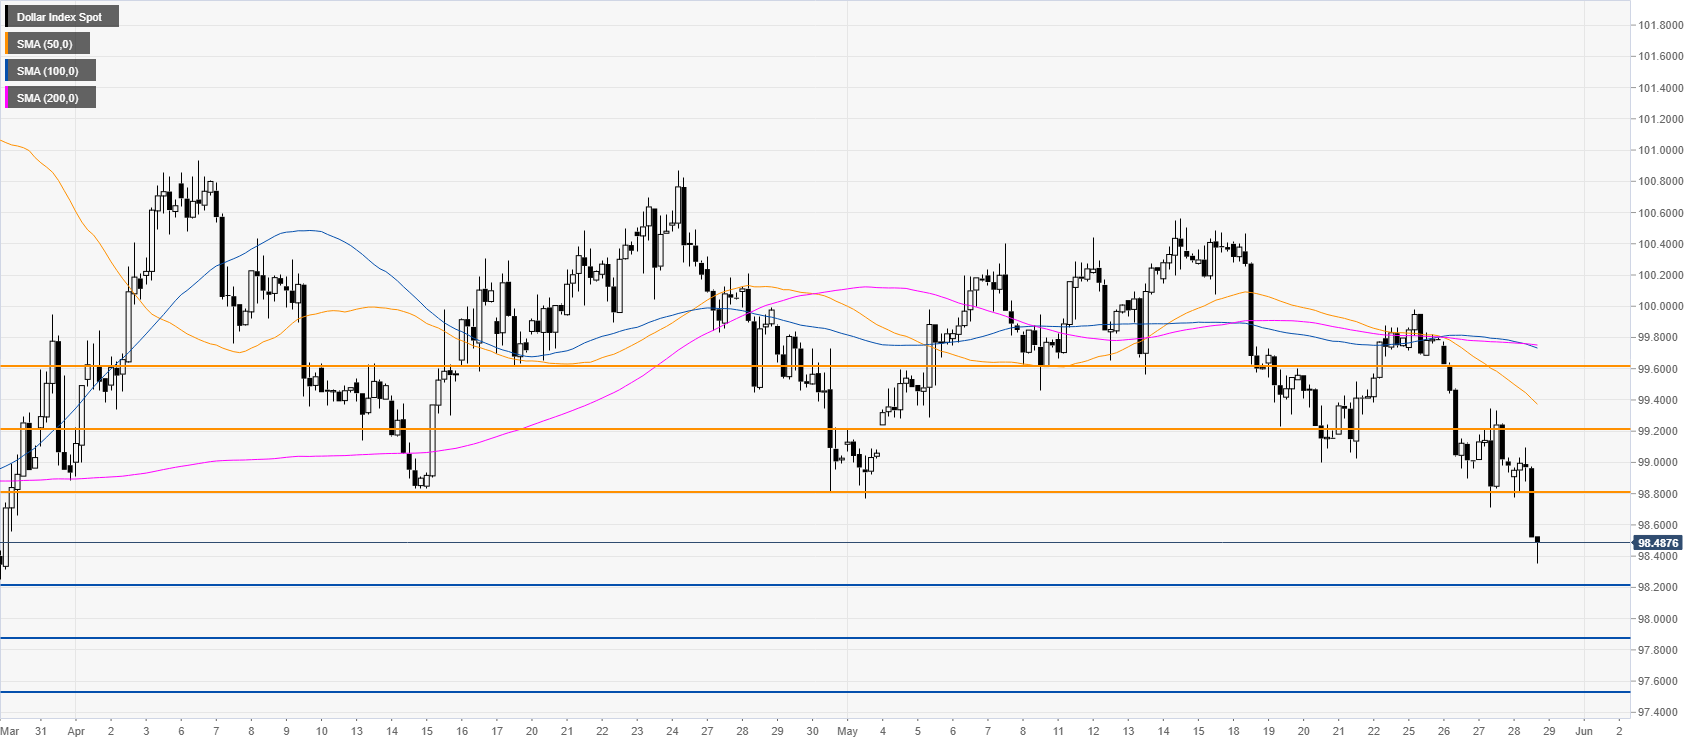
DXY four-hour chart
DXY is breaking the range it has been in the last weeks as bears took over the market. As the greenback is so weak, the current down move can extend further with 98.20/98.00 support zone next on the radar followed by the 97.50 level. Resistance should emerge near the 98.80, 99.20 and 99.60 price levels.

Additional key levels
