Back
5 Feb 2020
NZD/USD Price Analysis: Kiwi bears eyeing the 2020 lows
- NZD/USD remains under selling pressure as bears are eying the 2020 lows and below.
- The level to beat for sellers is the 0.6447 support.
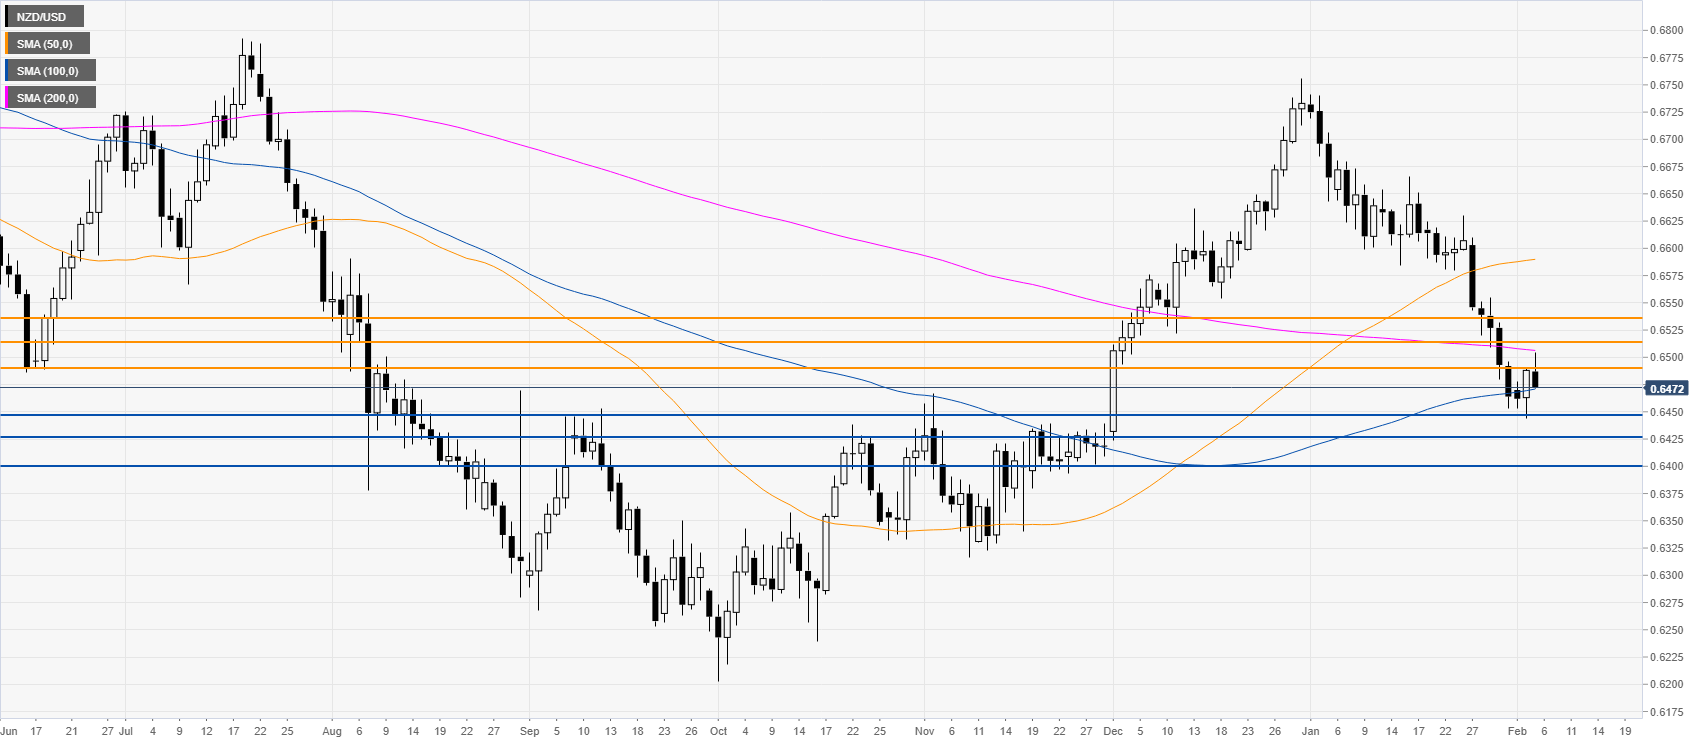
NZD/USD daily chart
NZD/USD dropped throughout January. It is now trading just below the 200 simple moving average (SMAs) while challenging the 100 SMA. After a shallow retracement up, the sellers are likely looking for an extension of the bear move and a break of the 0.6447 support with a potential drop near the 0.6427 and 0.6400 price levels, according to the Technical Confluences Indicator. Resistances are seen near the 0.6490, 0.6514 and 0.6535 price levels.
Resistance: 0.6490, 0.6514, 0.6535
Support: 0.6447, 0.6427, 0.6400
Additional key levels