WTI Price Analysis: Under pressure inside three-week-old falling channel
- WTI fails to extend recovery from the bearish formation’s support, ignores bullish MACD.
- 200-bar SMA acts as the key upside resistance.
- Multiple lows from early-2019 lure sellers during further declines.
WTI stays on the back foot while flashing $53.15 as a quote during Thursday’s Asian session. The energy benchmark fails to cross late-Friday tops during its latest bounce. In doing so, it justifies the near-term bearish formation.
That said, oil prices are now declining towards the weekly low of $52.17 while the channel’s support line near $50.70 can lure the bears afterward.
Though, multiple lows marked since late-January 2019 around $50.60 and $50.00 round-figure could keep the sellers checked below $50.70.
Meanwhile, an immediate horizontal resistance line near $54.40 and the bearish pattern’s upper line, at $54.65, could keep the energy benchmark’s near-term recovery capped.
If at all buyers manage to conquer $54.65, 200-bar SMA level near $59.30 will keep them away from $60.00 resistance.
WTI four hour chart
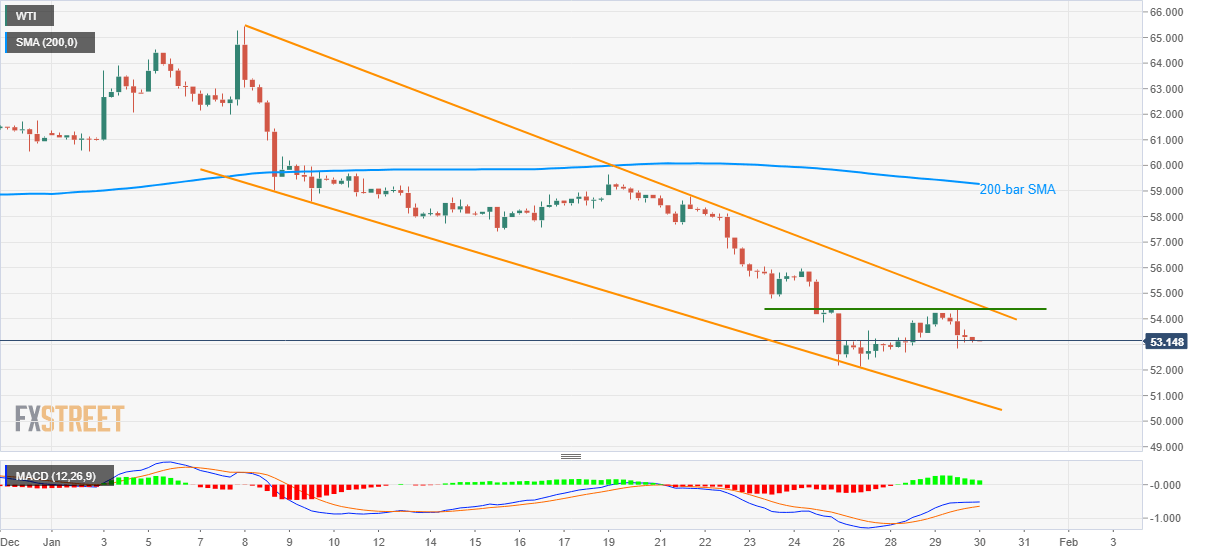
Trend: Bearish