Back
31 Oct 2019
GBP/USD technical analysis: Cable easing from daily highs trading below 1.2950 level
- GBP/USD is retracing down from daily highs in the New York session.
- The level to beat for bulls is the 1.2933/50 resistance.
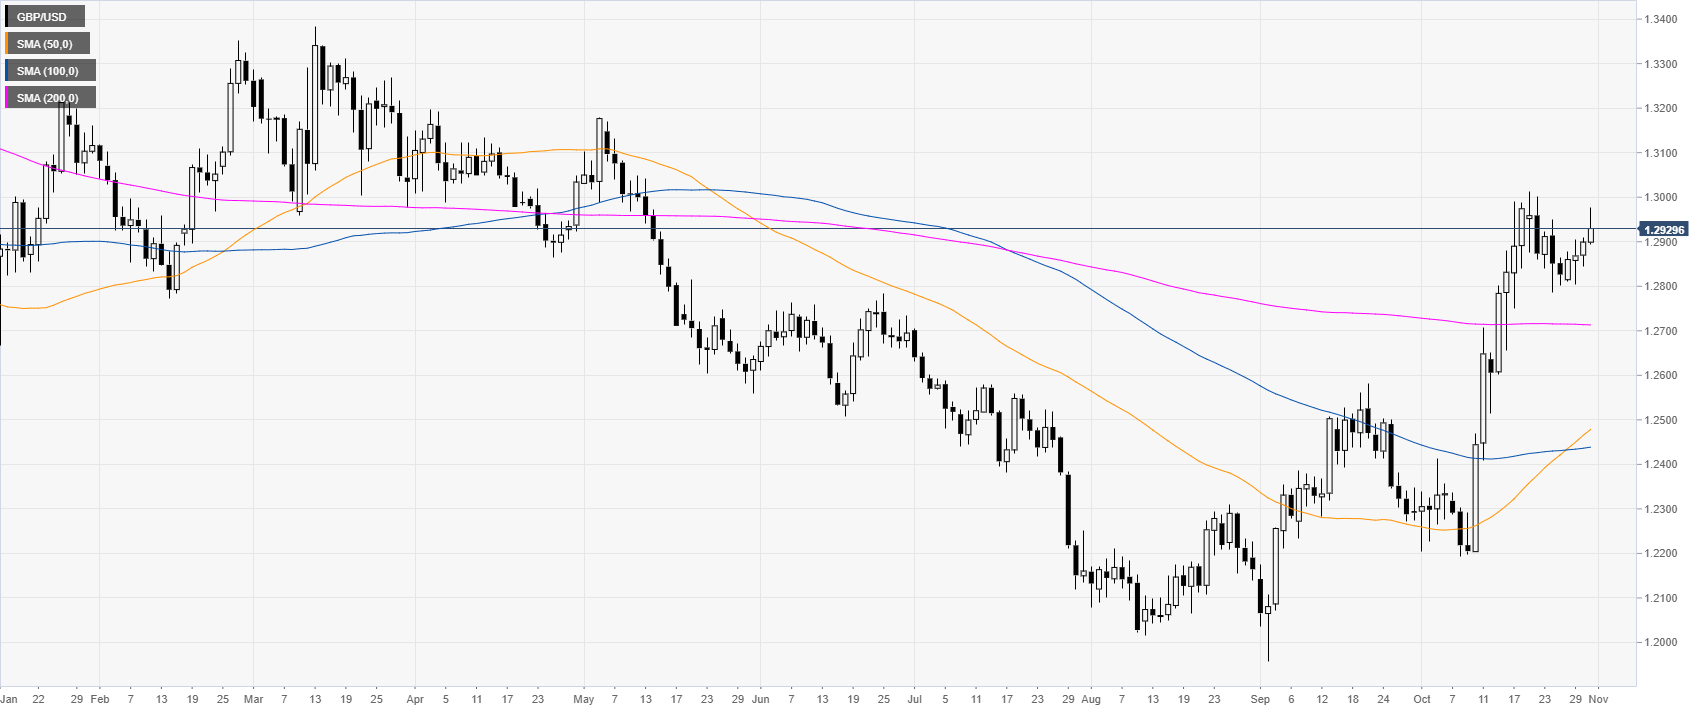
GBP/USD daily chart
In October, GBP/USD spiked above the main daily simple moving averages (DMAs) and reached levels not seen since mid-May 2019. Buyers want to break above the 1.3000 handle and the October high.
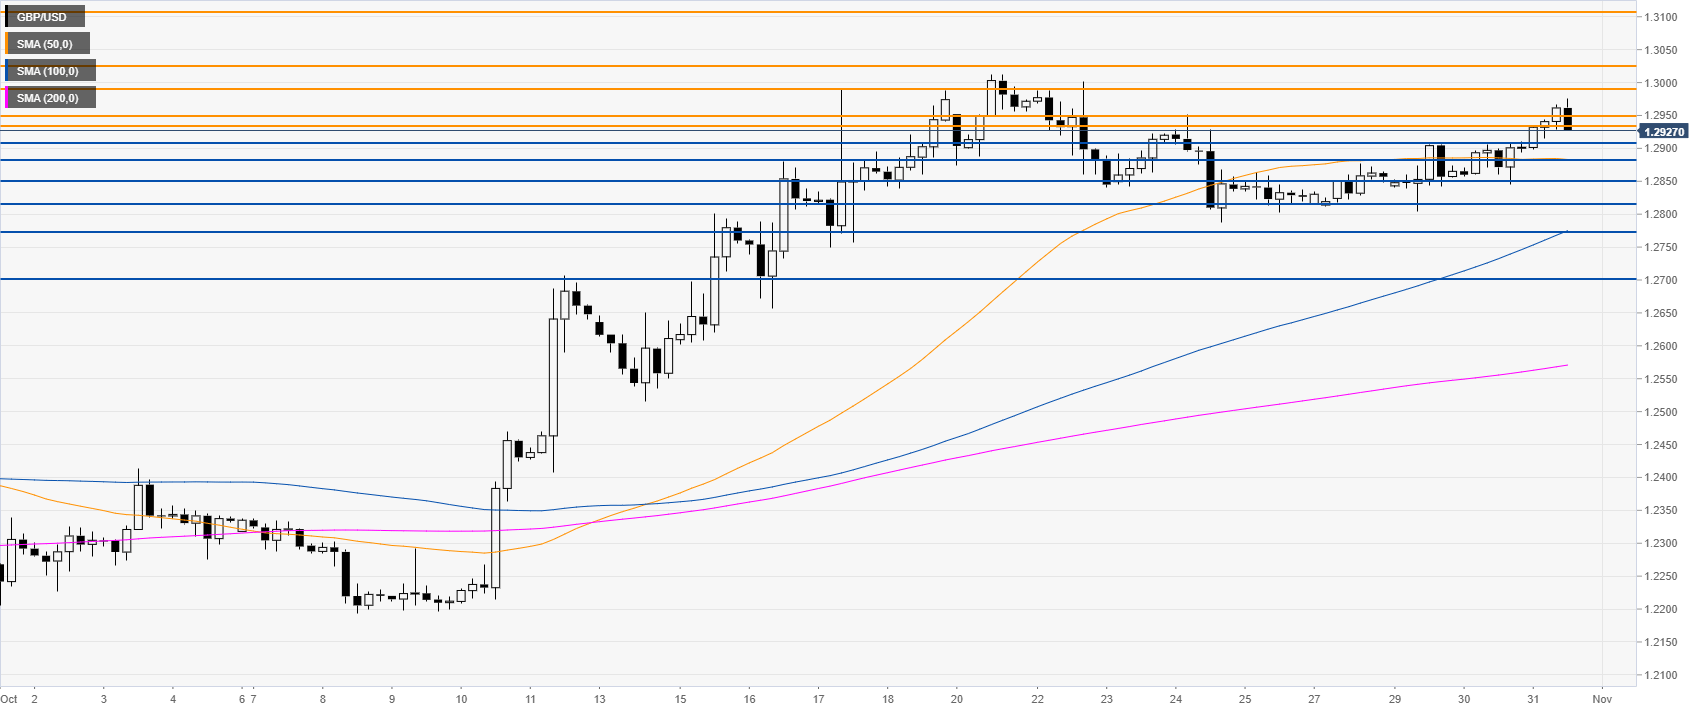
GBP/USD four-hour chart
GBP/USD is trading above the 1.2900 figure and the main SMAs on the four-hour chart, suggesting bullish momentum in the medium term. Bulls need to break the 1.2989 resistance in order to open the doors to more gains towards 1.3024 and the 1.3100 handle.
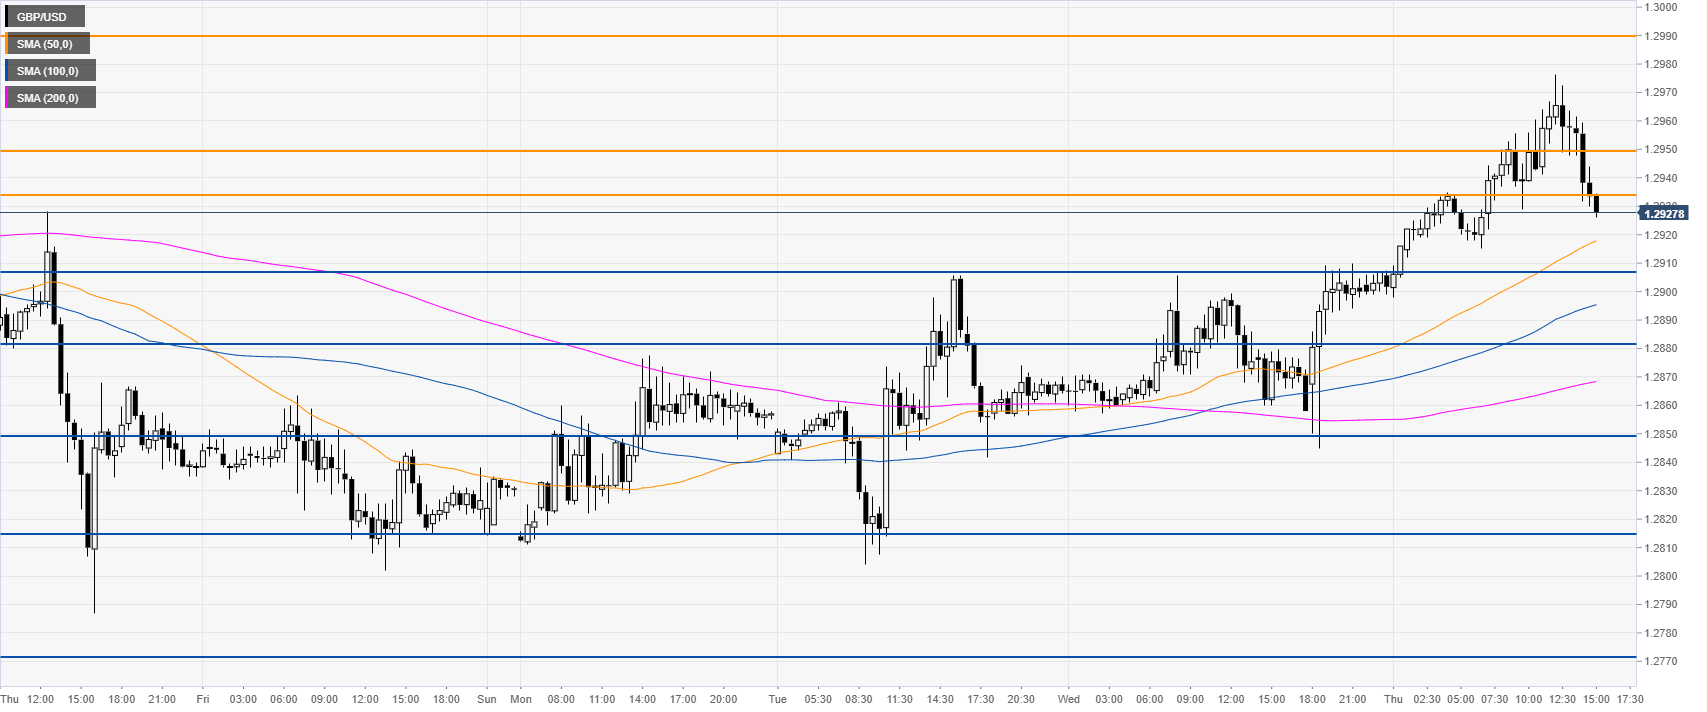
GBP/USD 30-minute chart
GBP/USD is retracing down from the current daily highs, now trading below the 1.2933/50 resistance zone. In the short term, the market might continue to decline towards 1.2909 and 1.2880 support, according to the Technical Confluences Indicator.
Additional key levels