Back


18 Sep 2019
USD/JPY technical analysis: Greenback sidelined ahead of the FOMC
- USD/JPY is trading in a 20-pip range ahead of the FOMC at 18:00 GMT.
- The market is directionless ahead of the event, which should unlock the situation.
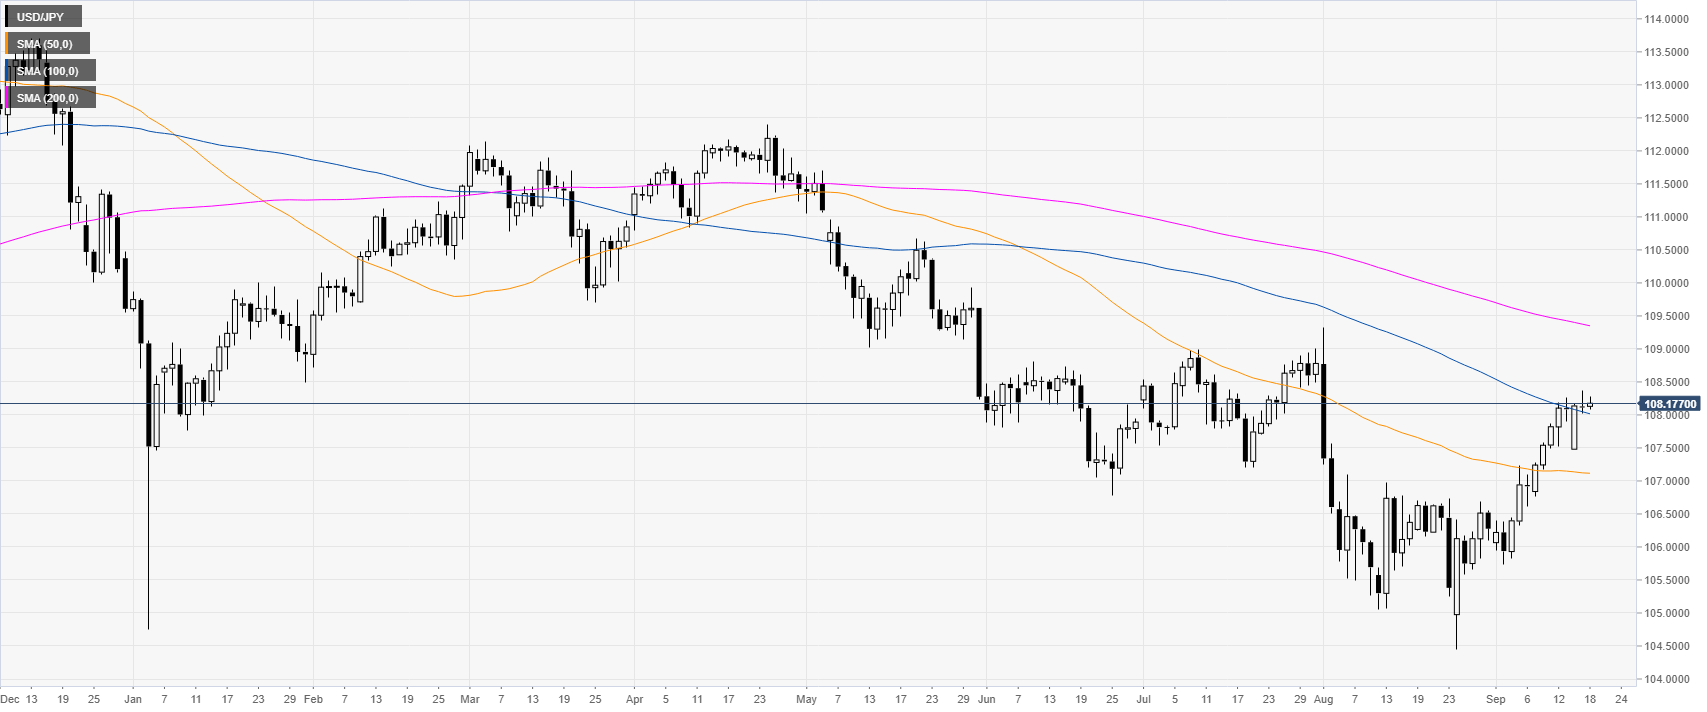
USD/JPY daily chart
USD/JPY is trading in a bear trend below the 200-day simple moving averages (SMA). However, in the last two months, USD/JPY had a substantial advance which is now challenging the 100 SMA and the 108.00 handle.

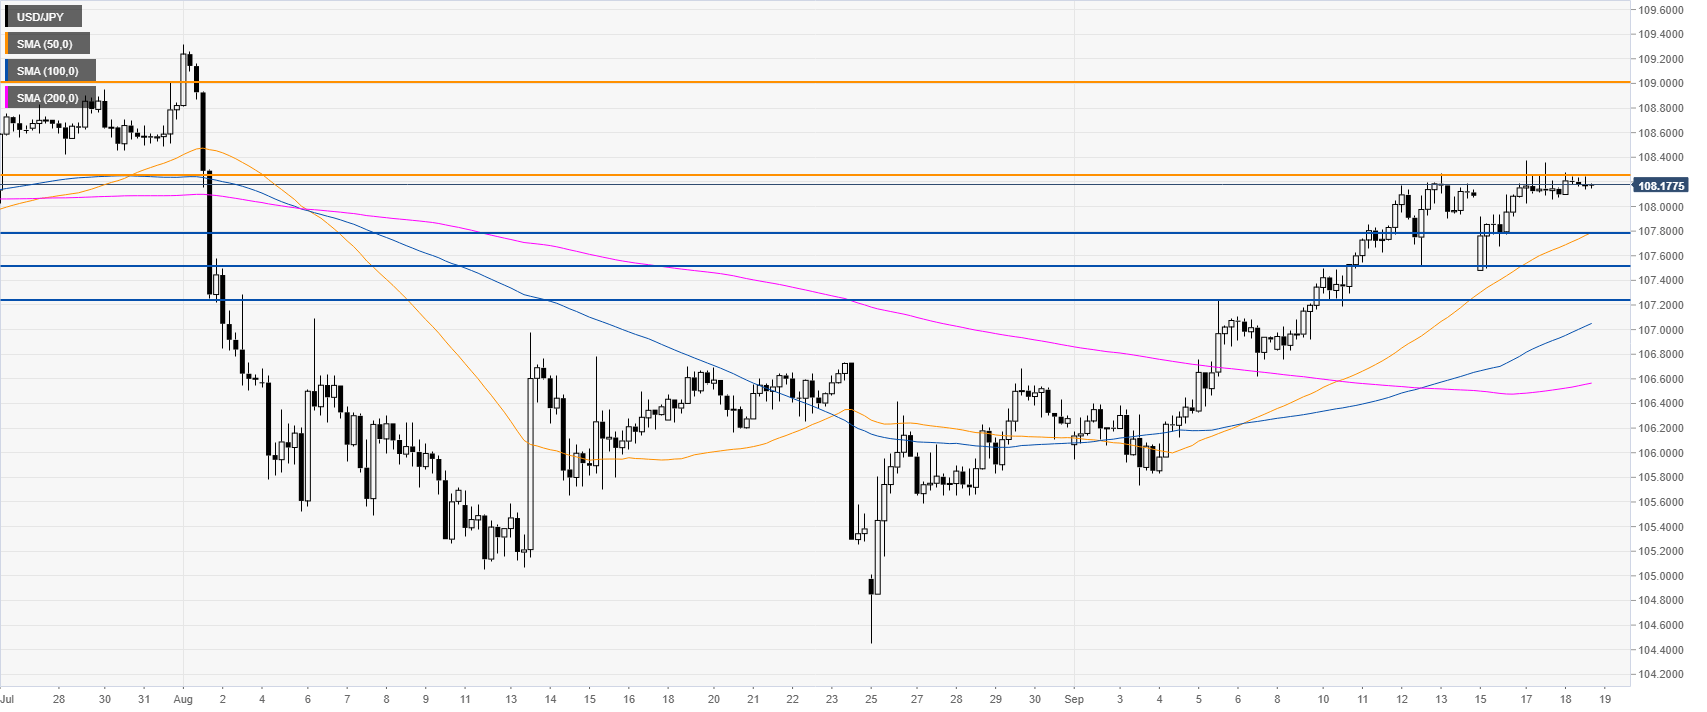
USD/JPY 4-hour chart
USD/JPY is trading above the main SMAs, suggesting a bullish bias in the medium term. The bull trend remains intact as bulls will try to push the spot beyond the 108.24 resistance level in order to potentially target the 109.00 resistance level, according to the Technical Confluences Indicator. However, the market is relatively balanced and the FOMC at 18:00 GMT will likely unlock the status quo.

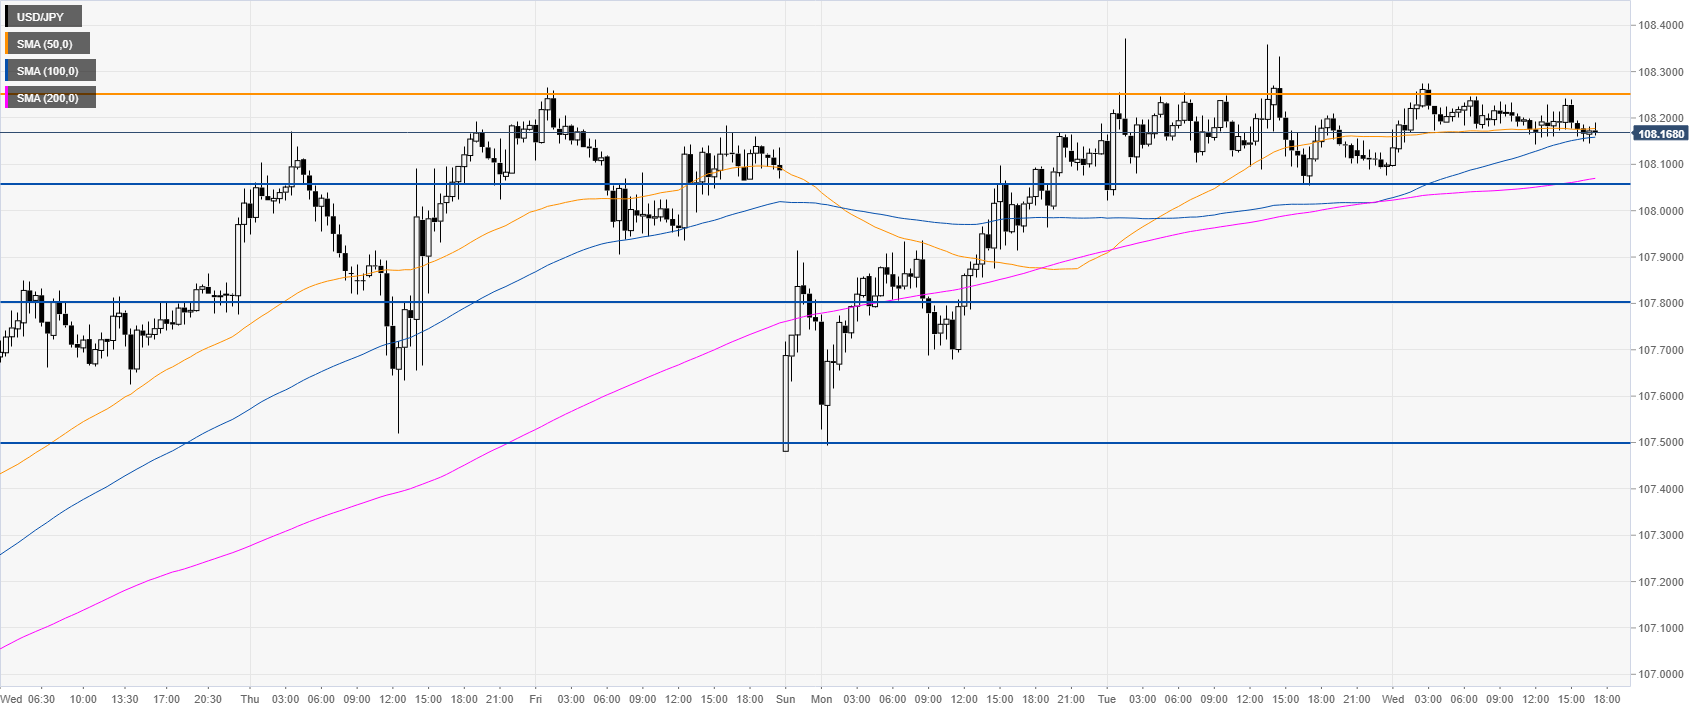
USD/JPY 30-minute chart
Dollar/Yen is trading above the main SMAs, suggesting bullish momentum in the near term. If the FOMC is perceived as dovish, USD/JPY will likely trade south towards 108.05, 107.80 and 107.50 price levels, according to the Technical Confluences Indicator.
Additional key levels

