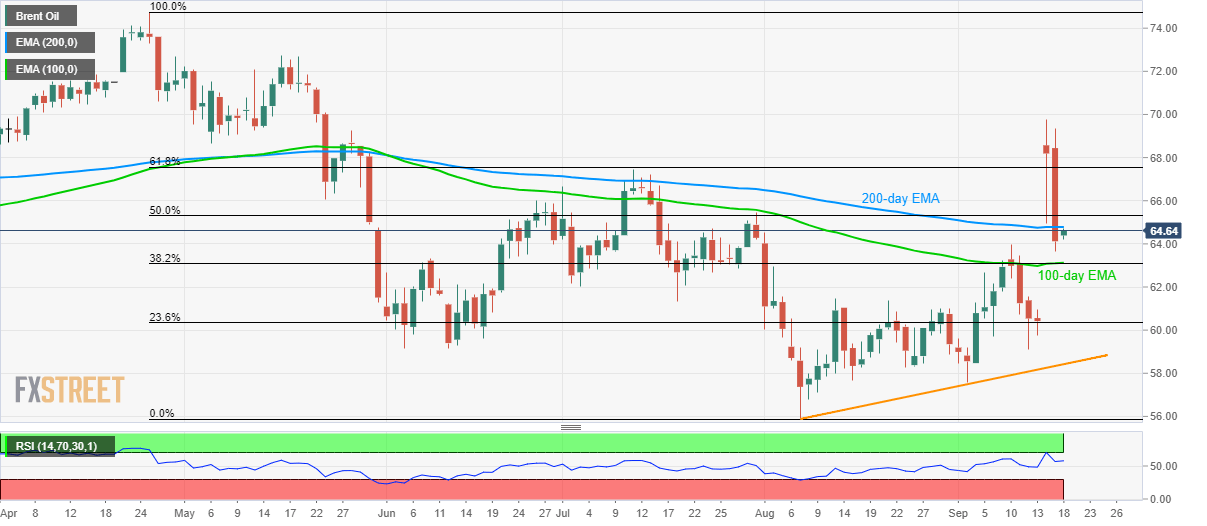
Brent technical analysis: 200-day EMA exerts downside pressure towards $63.15/10
- Brent Oil’s latest recovery fails to cross 200-day EMA.
- 100-day EMA, 38.2% Fibonacci retracement becomes key support to watch.
Irrespective of Brent’s latest bounce off $64.20, the black gold remains below the 200-day exponential moving average (EMA) while taking rounds to $64.65 ahead of the London open on Wednesday.
The British oil benchmark’s sustained trading below key EMA increases the odds of its further declines towards 100-day EMA, 38.2% Fibonacci retracement of April-August drop, near $63.15/10.
In a case where bears dominate past-$63.10, multiple tops flashed during early-August can lure them to $61.50/40 support-area.
Meanwhile, a successful break above 200-day EMA level of $64.80 needs to overcome a 50% Fibonacci retracement level of $65.30 in order to aim for July month high of $67.45.
Additionally, buyers’ ability to cross $67.45 on a daily closing basis can renew hopes for the run-up towards latest high surrounding $69.80.
Brent Oil daily chart

Trend: bearish
