Back
26 Jul 2019
GBP/USD technical analysis: Cable rolling into the Asian session, sub-1.2480 resistance
- GBP/USD ends Thursday near its lows well below 1.2480 resistance.
- The levels to beat for bears are seen at 1.2435 and 1.2388, according to the Technical Confluences Indicator.
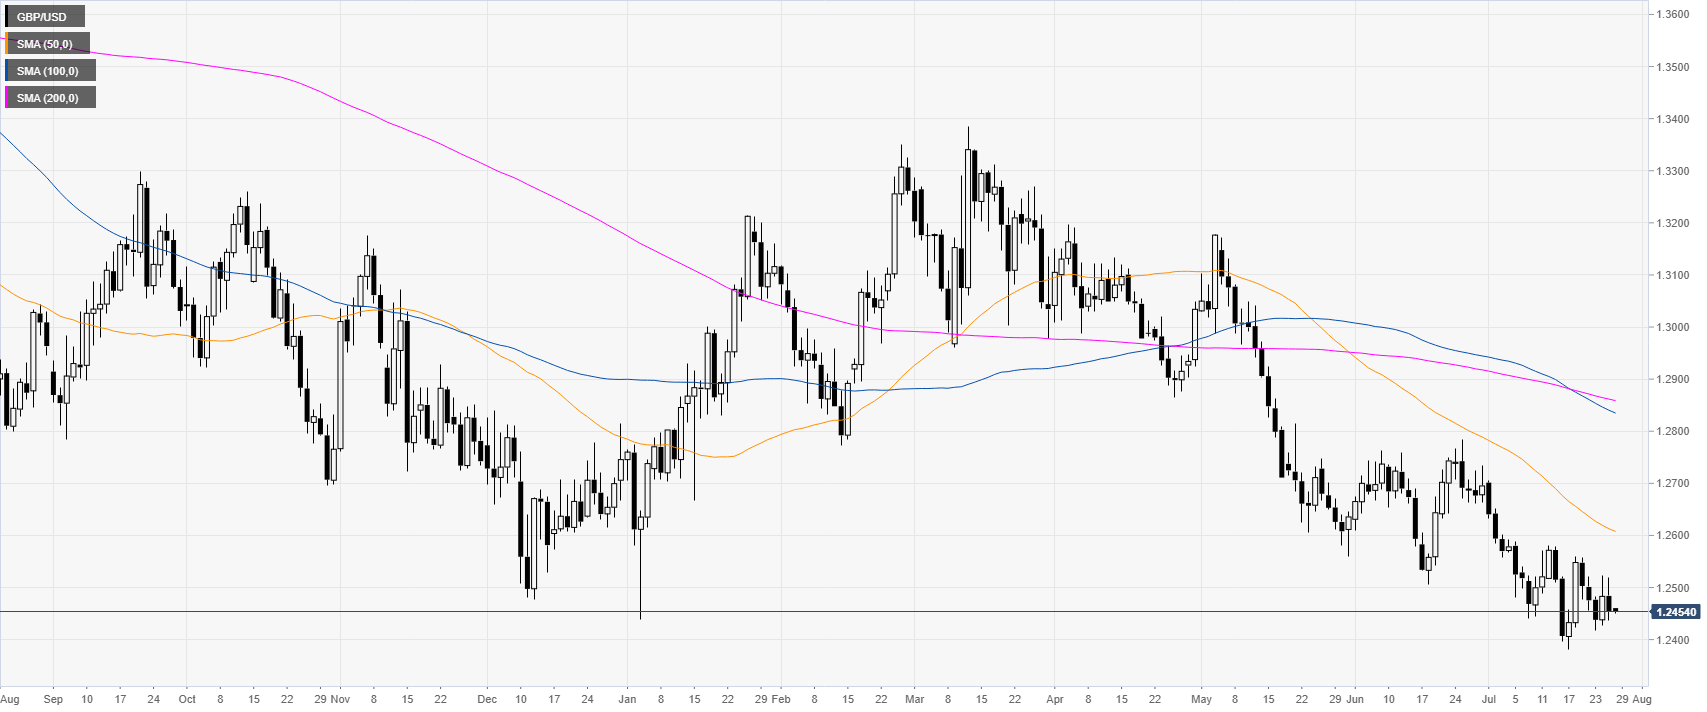
GBP/USD daily chart
Cable is trading in a bear trend below the main daily simple moving averages (DSMAs).
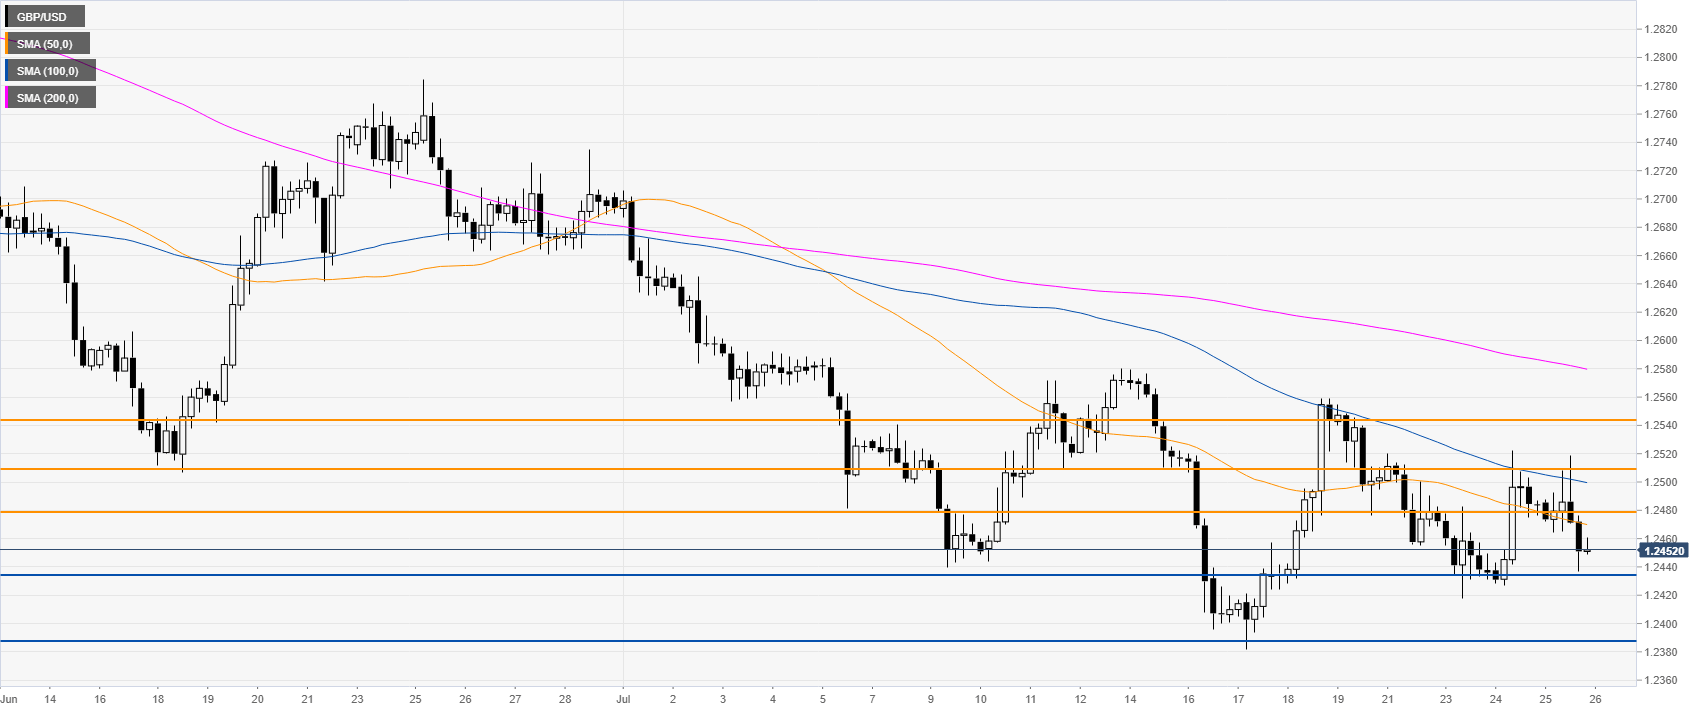
GBP/USD 4-hour chart
GBP/USD is trading below 1.2480 resistance and descending SMAs suggesting a negative bias in the medium term. Bears need a break below 1.2435 support to travel south towards 1.2388. Resistances are seen near 1.2480 and 1.2510, according to the Technical Confluences Indicator.
Additional key levels