Back
8 Aug 2018
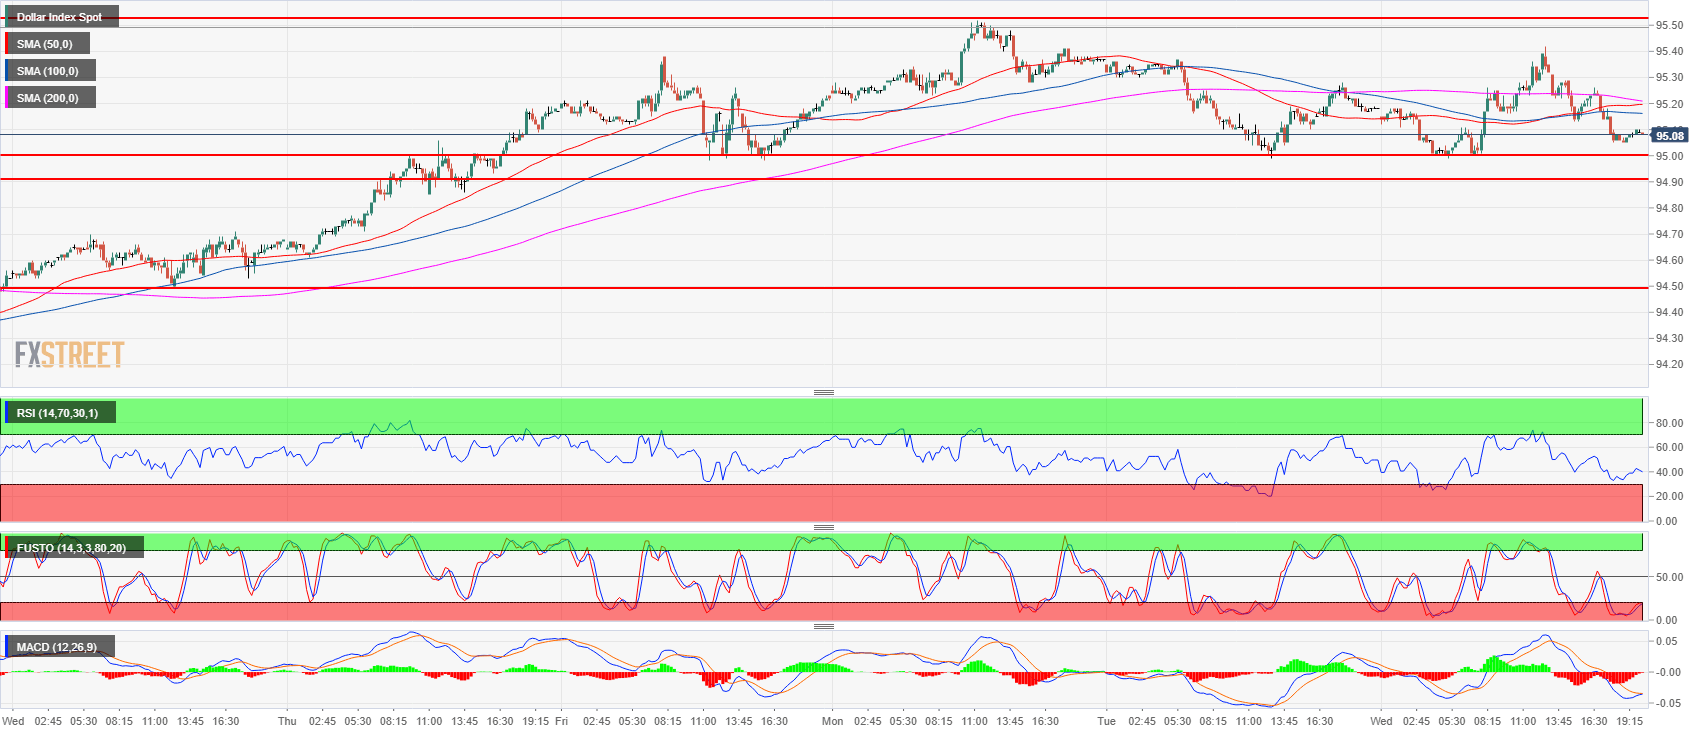
US Dollar Index: DXY holding above 95.00 level
- The US Dollar Index (DXY) has found some resistance at 95.52 on Monday and the market has been rotating lower ever since.
- Bears objective is to break below the 95.00 in order to target 94.91 July 27 high and then 94.61 August 2, low.
- On the flip side, bulls want to support the market and prevent the breakout below 95.00 from happening. If bulls can manage to break above Wednesday’s high at 95.42, some bears might give up as they could see it as the resumption of the bull trend.
DXY 15-minute chart
DXY daily chart
-636693563088774820.png)
Spot rate: 95.09
Relative change: -0.10%
High: 95.42
Low: 94.99
Trend: Bullish / Bearish pullback below 95.00
Resistance 1: 95.24 July 13 high
Resistance 2: 95.52 August 6 high
Resistance 3: 95.65 current 2018 high
Resistance 4: 96.00 figure
Resistance 5: 96.51 July 05, 2017 high
Support 1: 95.00 figure
Support 2: 94.91 July 27 high
Support 3: 94.61 August 2, low
Support 4: 94.49 August 1 low
Support 5: 94.08 July 26 swing low
Support 6: 93.71 July 9 swing low
Support 7: 92.24 May 14 low