USD/CAD Price Prediction: Countertrend rally might be stalling
- USD/CAD has pulled back after bottoming on September 25.
- The correction that ensued now seems to have run its course and the pair could be vulnerable to recapitulation.
USD/CAD suddenly reversed course in the midst of a strong downtrend and recovered on September 25. The pair quickly rose up from 1.3420 to 1.3539 but now the rebound appears to have stalled after peaking at a similar level for the past two consecutive days (blue box on chart below).
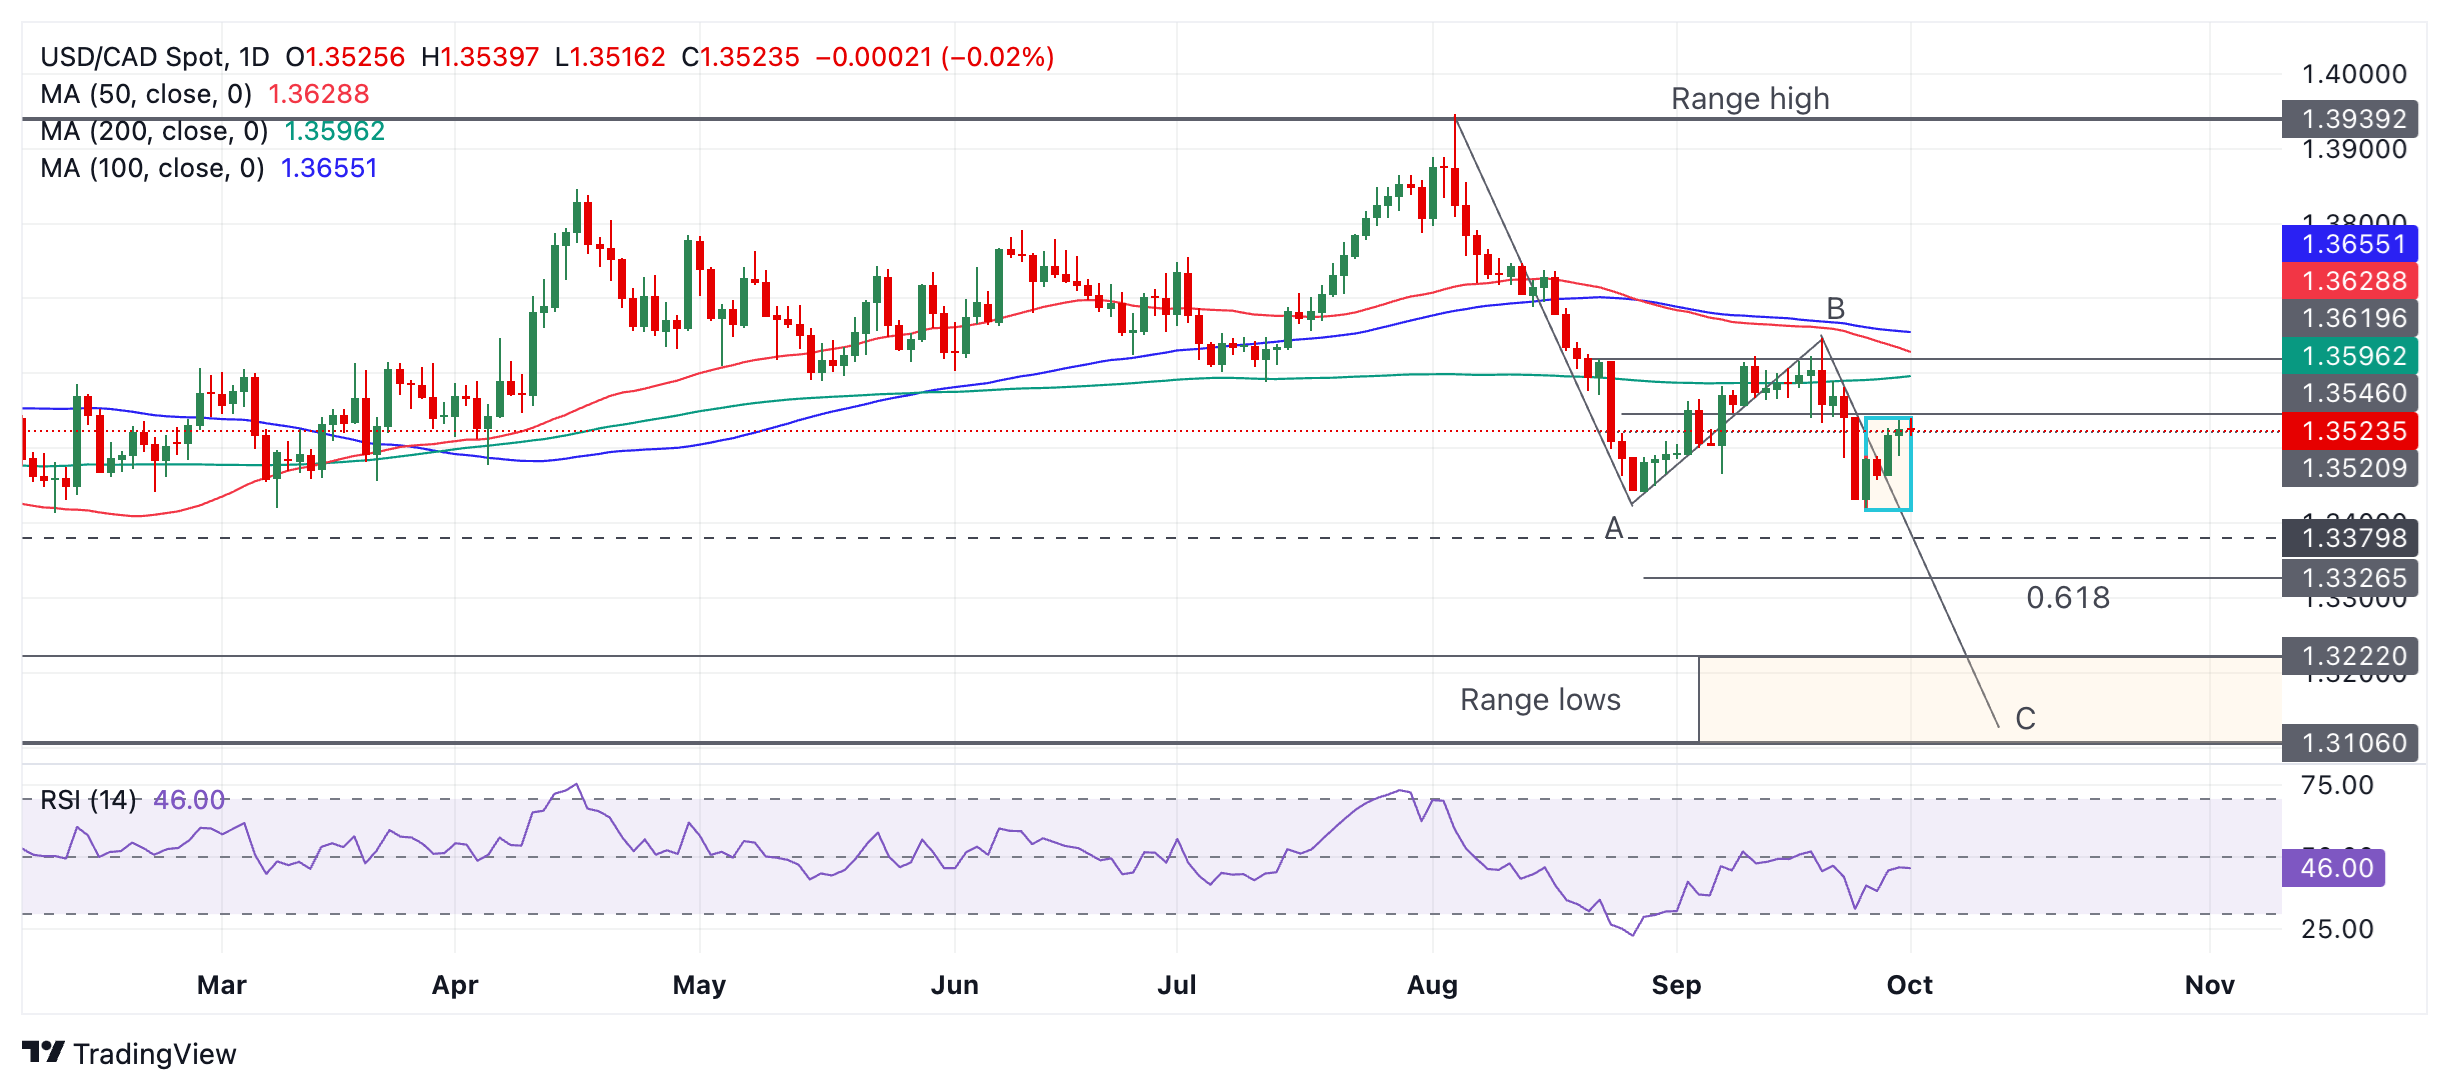
USD/CAD Daily Chart
There is a chance that the pullback has run its course and given the medium-term trend remains bearish prices might now start falling again.
A move below 1.3457 (September 26 low) would confirm a resumption of the downtrend, probably to at least the 1.3420 low of September 25. A close below that would provide bearish confirmation of more downside to the range lows – a zone beginning at around 1.3222 and ending at 1.3106.
USD/CAD seems to have formed a large zig-zag pattern known as a Measured Move since peaking on August 5. If so, then it augurs bearish for the pair as the downside target for the last wave C of the pattern is at a minimum 1.3326, the 61.8% Fibonacci extension of wave A.