EUR/USD Price Analysis: Bulls are pressured at a key juncture
- EUR/USD bulls need to commit or face a significant slide toward 1.0520s.
- Bears eye a break of the 1.0670 support area.
EUR/USD has traded down on the day and is lowing some 0.27% at the time of writing, traveling between a high of 1.0732 and a low of 1.0667 so far.
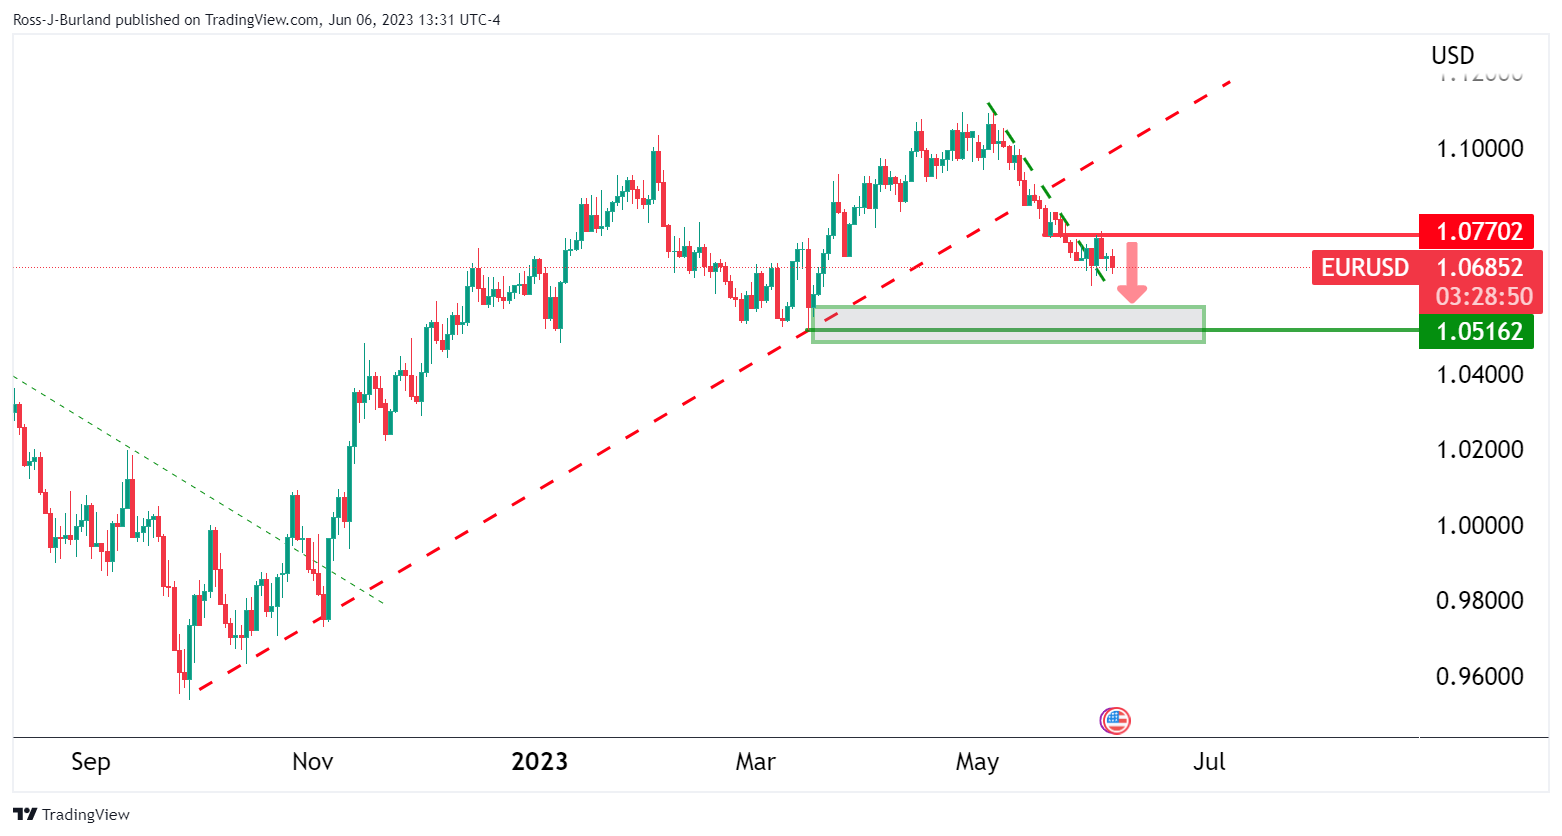
The daily chart shows that the price is pressured below the longer-term bullish trendline that is now considered to be a counter-trendline resistance.
EUR/USD daily chart

The price is also pressured below horizontal resistance, although it is sliding sideways out of the bearish trend.
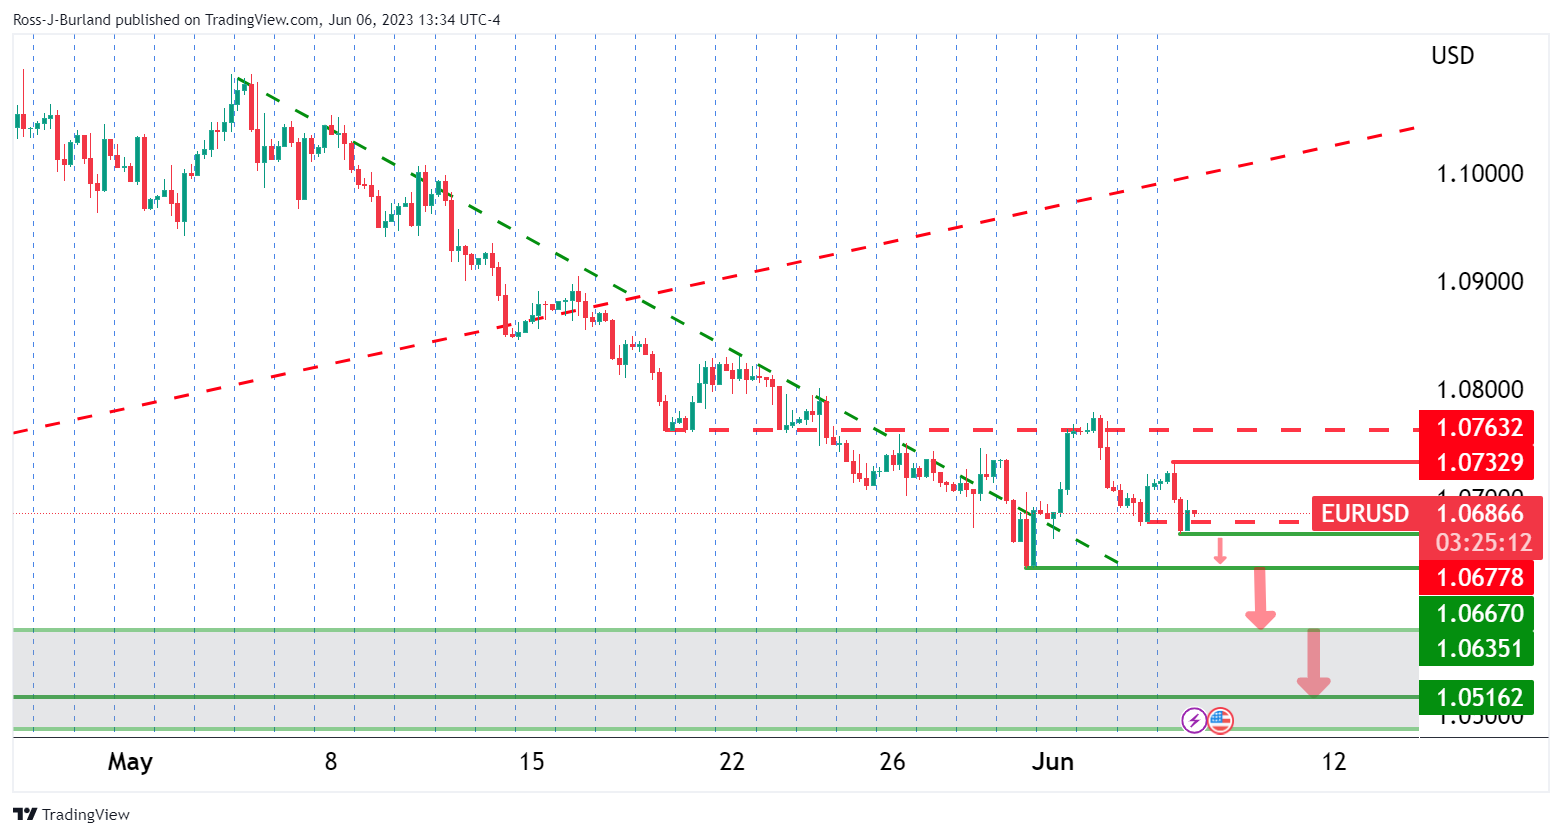
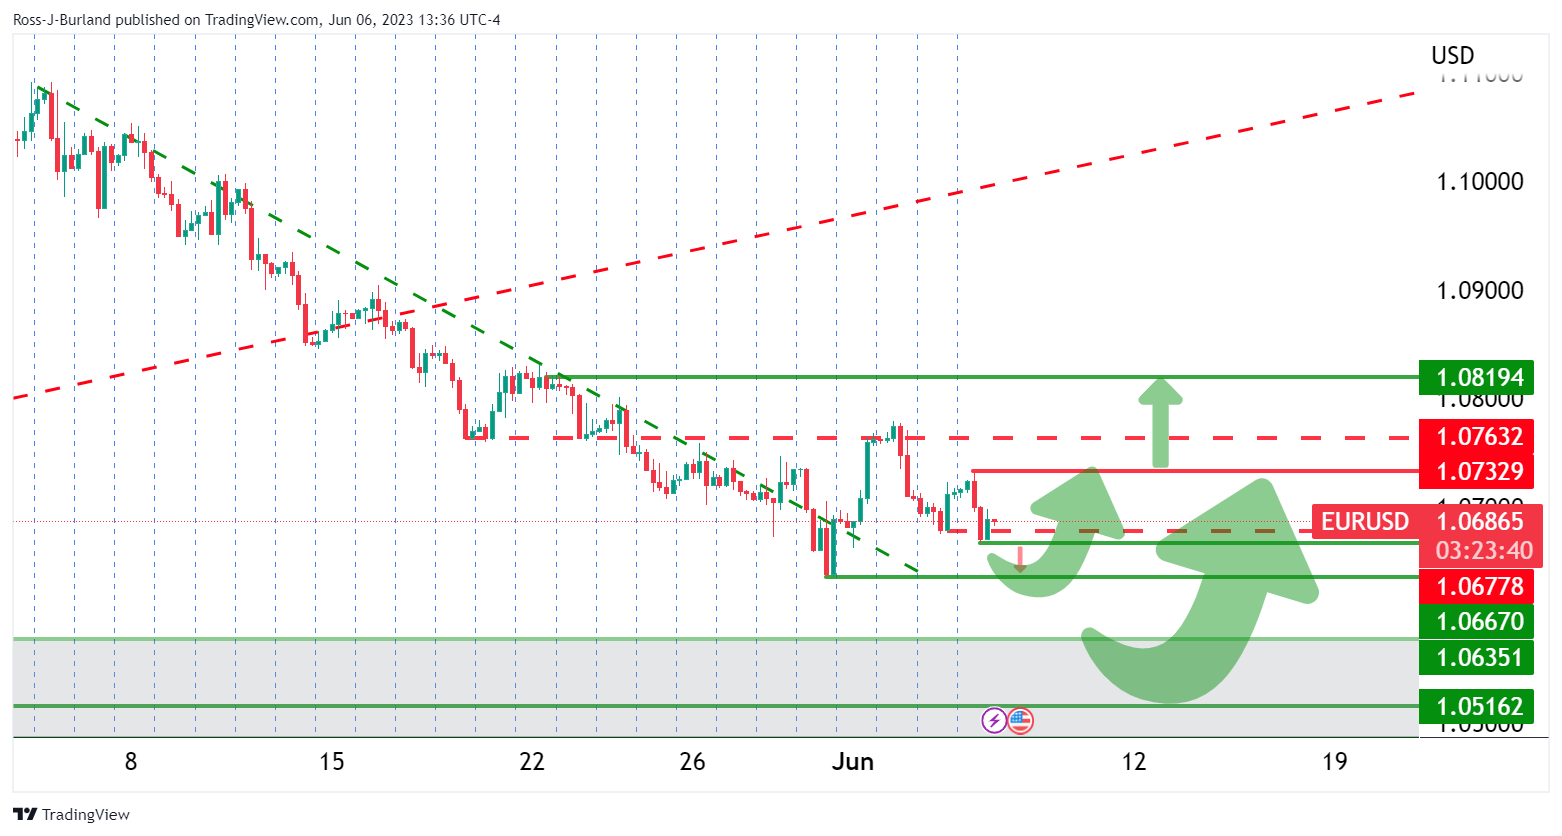
EUR/USD H4 charts

Moving down to the 4-hour charts for a closer inspection, we can see the price is trading sideways between 1.0670ish and 1.0730ish. While below resistance, 1.0770ish, the focus is on the downside and a test of the 1.0670ish support area. A break of here will open risk to test a daily 1.0520ish support area.

On the other hand, given we are on the backside of the old bearish trend, the market could just as easily stall at this juncture, or lower down, and turn higher as the above schematic illustrates.
