AUD/JPY Price Analysis: Climbs despite a sour market sentiment, buyers' eye 88.00
- AUD/JPYretrats from daily highs, on risk-off impulse.
- AUD/JPY correction fails to shake bearish bias, resistance at 20-day EMA.
- AUD/JPY is on the rise as the 4-hour chart shows bullish momentum
AUD/JPY edges down as the Asian session begins, but Tuesday’s gains opened the door for further upside in the pair. However, the AUD/JPY is still downward pressured, but resistance at the 20-day Exponential Moving Average (EMA) at 88.77 could be challenged. At the time of writing, the AUD/JPY is trading at 87.70.
AUD/JPY Price action
After printing back-to-back bullish candles, the AUD/JPY corrected upwards, yet a bearish bias remains. To change the pair’s preference to neutral, AUD/JPY buyers must conquer the 20-day EMA at 88.77 before reclaiming 89.00. Once achieved, the next resistance would be the 50-day EMA at 89.99, around 90.00. Conversely, the AUD/JPY would continue its downtrend if the pair stumbles below the March 28 low of 87.15, which could open the door for further losses.
In the near term, the AUD/JPY 4-hour chart portrays the pair’s testing of the 50-EMA at 87.91. The Relative Strength Index (RSI) in bullish territory favors upside price action, the same as the Rate of Change (RoC). Therefore, the AUD/JPY path of least resistance is upwards.
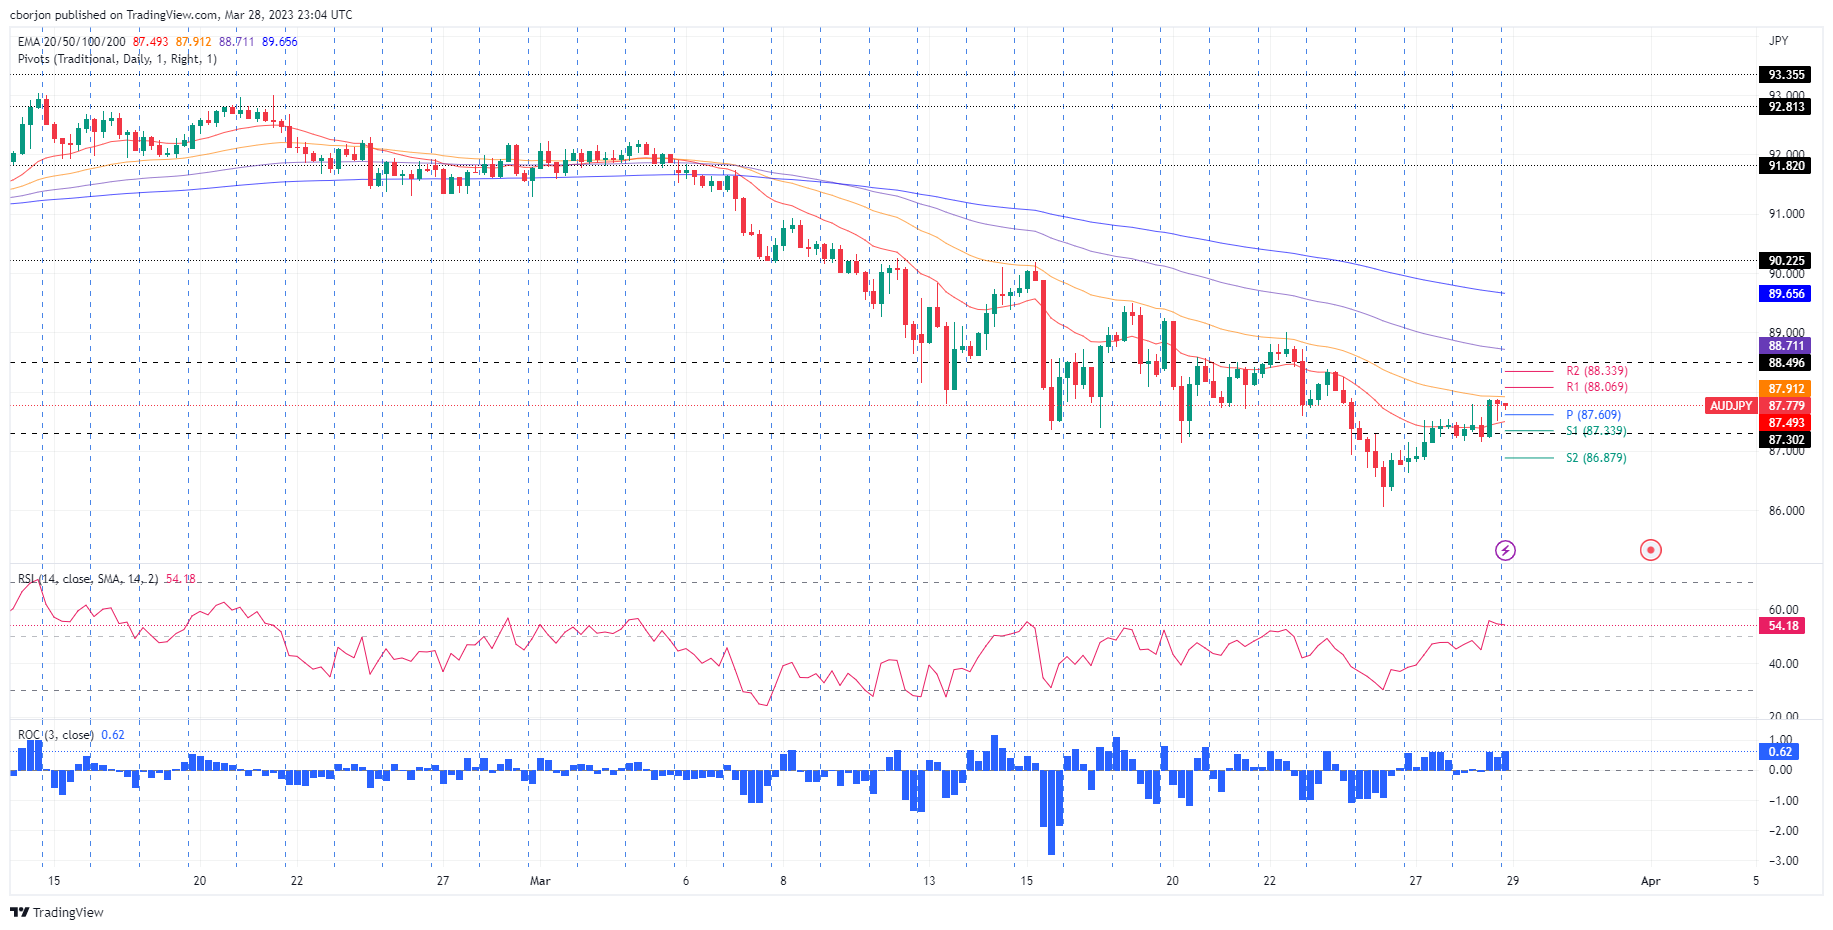
The AUD/JPY first resistance would be the confluence of the R1 pivot and the 88.00 figure. A breach of the latter will expose the R2 pivot at 88.34 before testing the 100-EMA at 88.71. On the flip side, the AUD/JPY first support would be the daily pivot at 87.61, followed by the 20-EMA At 87.49, ahead of testing the S1 pivot at 87.34.
AUD/JPY 4-hour chart chart
AUD/JPY Technical levels