NZD/USD Price Analysis: Keeps pullback from 200-SMA below 0.620
- NZD/USD bounces off intraday low but stays down for the second consecutive day.
- Bearish MACD signals, downbeat RSI keeps sellers hopeful amid failures to cross 200-SMA, one-month-old resistance line.
- Weekly ascending trend line, YTD low lures Kiwi bears.
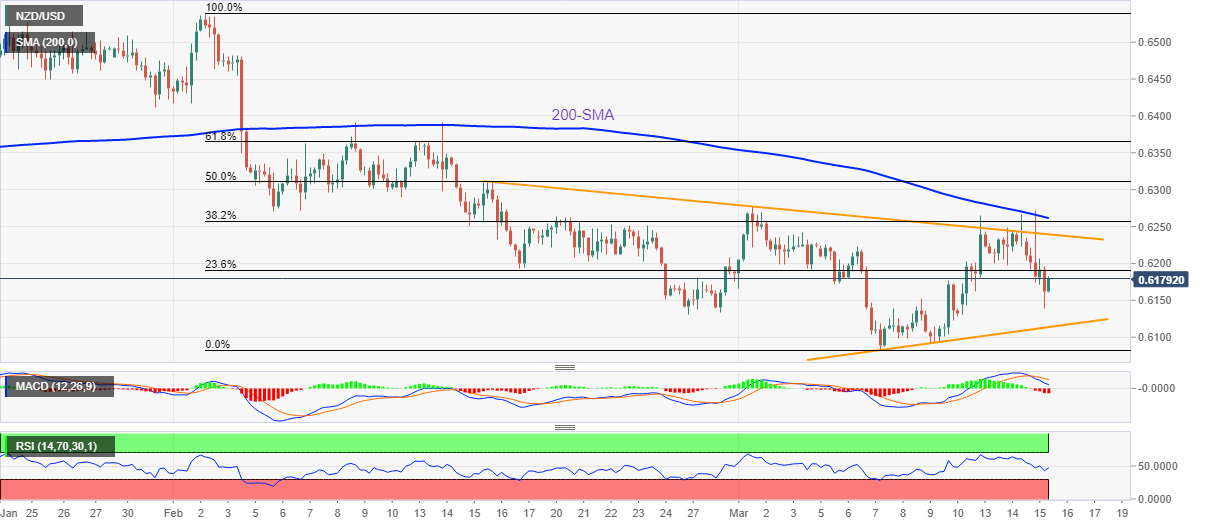
NZD/USD picks up bids to pare intraday losses around 0.6175 during early Thursday. Even so, the Kiwi pair remains down for the second consecutive day after reversing from the 200-SMA and one-month-old resistance line the previous day.
The NZD/USD pair’s failure to cross the aforementioned key hurdles joins bearish MACD signals and the downbeat RSI (14) line, not oversold, to keep the sellers hopeful of witnessing the quote’s further downside.
As a result, an upward-sloping support line from the last Thursday, near 0.6115 at the latest, gains the attention of intraday bears ahead of the monthly low, as well as the 2023 bottom, marked around 0.6085 in the last week.
It should be noted that the NZD/USD pair’s weakness past 0.6085 will need validation from the July 2022 low of 0.6060 to aim for the 0.6000 psychological magnet, also comprising the early September 2022 bottom.
Meanwhile, the 23.6% Fibonacci retracement level of the Kiwi pair’s February-March downside, near 0.6190, precedes the 0.6200 threshold to restrict immediate NZD/USD upside.
In a case where the quote remains firmer past 0.6200, the previously mentioned resistance line from mid-February and the 200-SMA, respectively near 0.6240 and 0.6265, will be in the spotlight.
NZD/USD: Four-hour chart

Trend: Further downside expected
